Trusted across the industry.
Running in offices and control rooms across the country, ez2view helps some of the industry's key decision-makers understand and navigate the complexity of the National Electricity Market (NEM).
ez2view is data acquisition, analysis and visualisation software used by a wide variety of stakeholders across Australia's NEM to:
- monitor the market and grid in real-time and;
- conduct detailed forensic analysis after the fact.
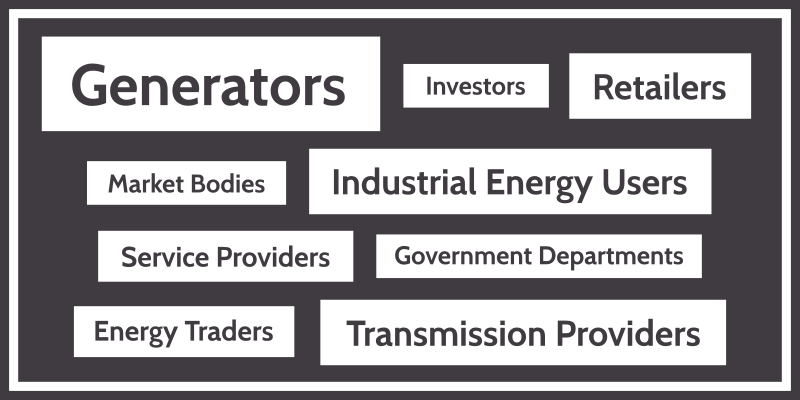
ez2view has been specifically designed for stakeholders who have significant exposure to the energy market.
First released in 2003 building on our popular NEMwatch dashboard, ez2view was one of the first software programs to provide NEM wholesale market and physical grid data in real-time. More than eighteen years, nine versions, and hundreds of thousands of developer hours later, ez2view remains a trusted tool across the industry, delivering fast access to insights to a diverse range of professionals.
Extensive coverage.
ez2view brings together thousands of data points from a variety of sources including AEMO, BOM Weather, ASX Futures, amongst many others and delivers it reliably and quickly in one integrated solution.
A comprehensive catalog of historical data is accessible, including NEM market data, going back up to 10 years.
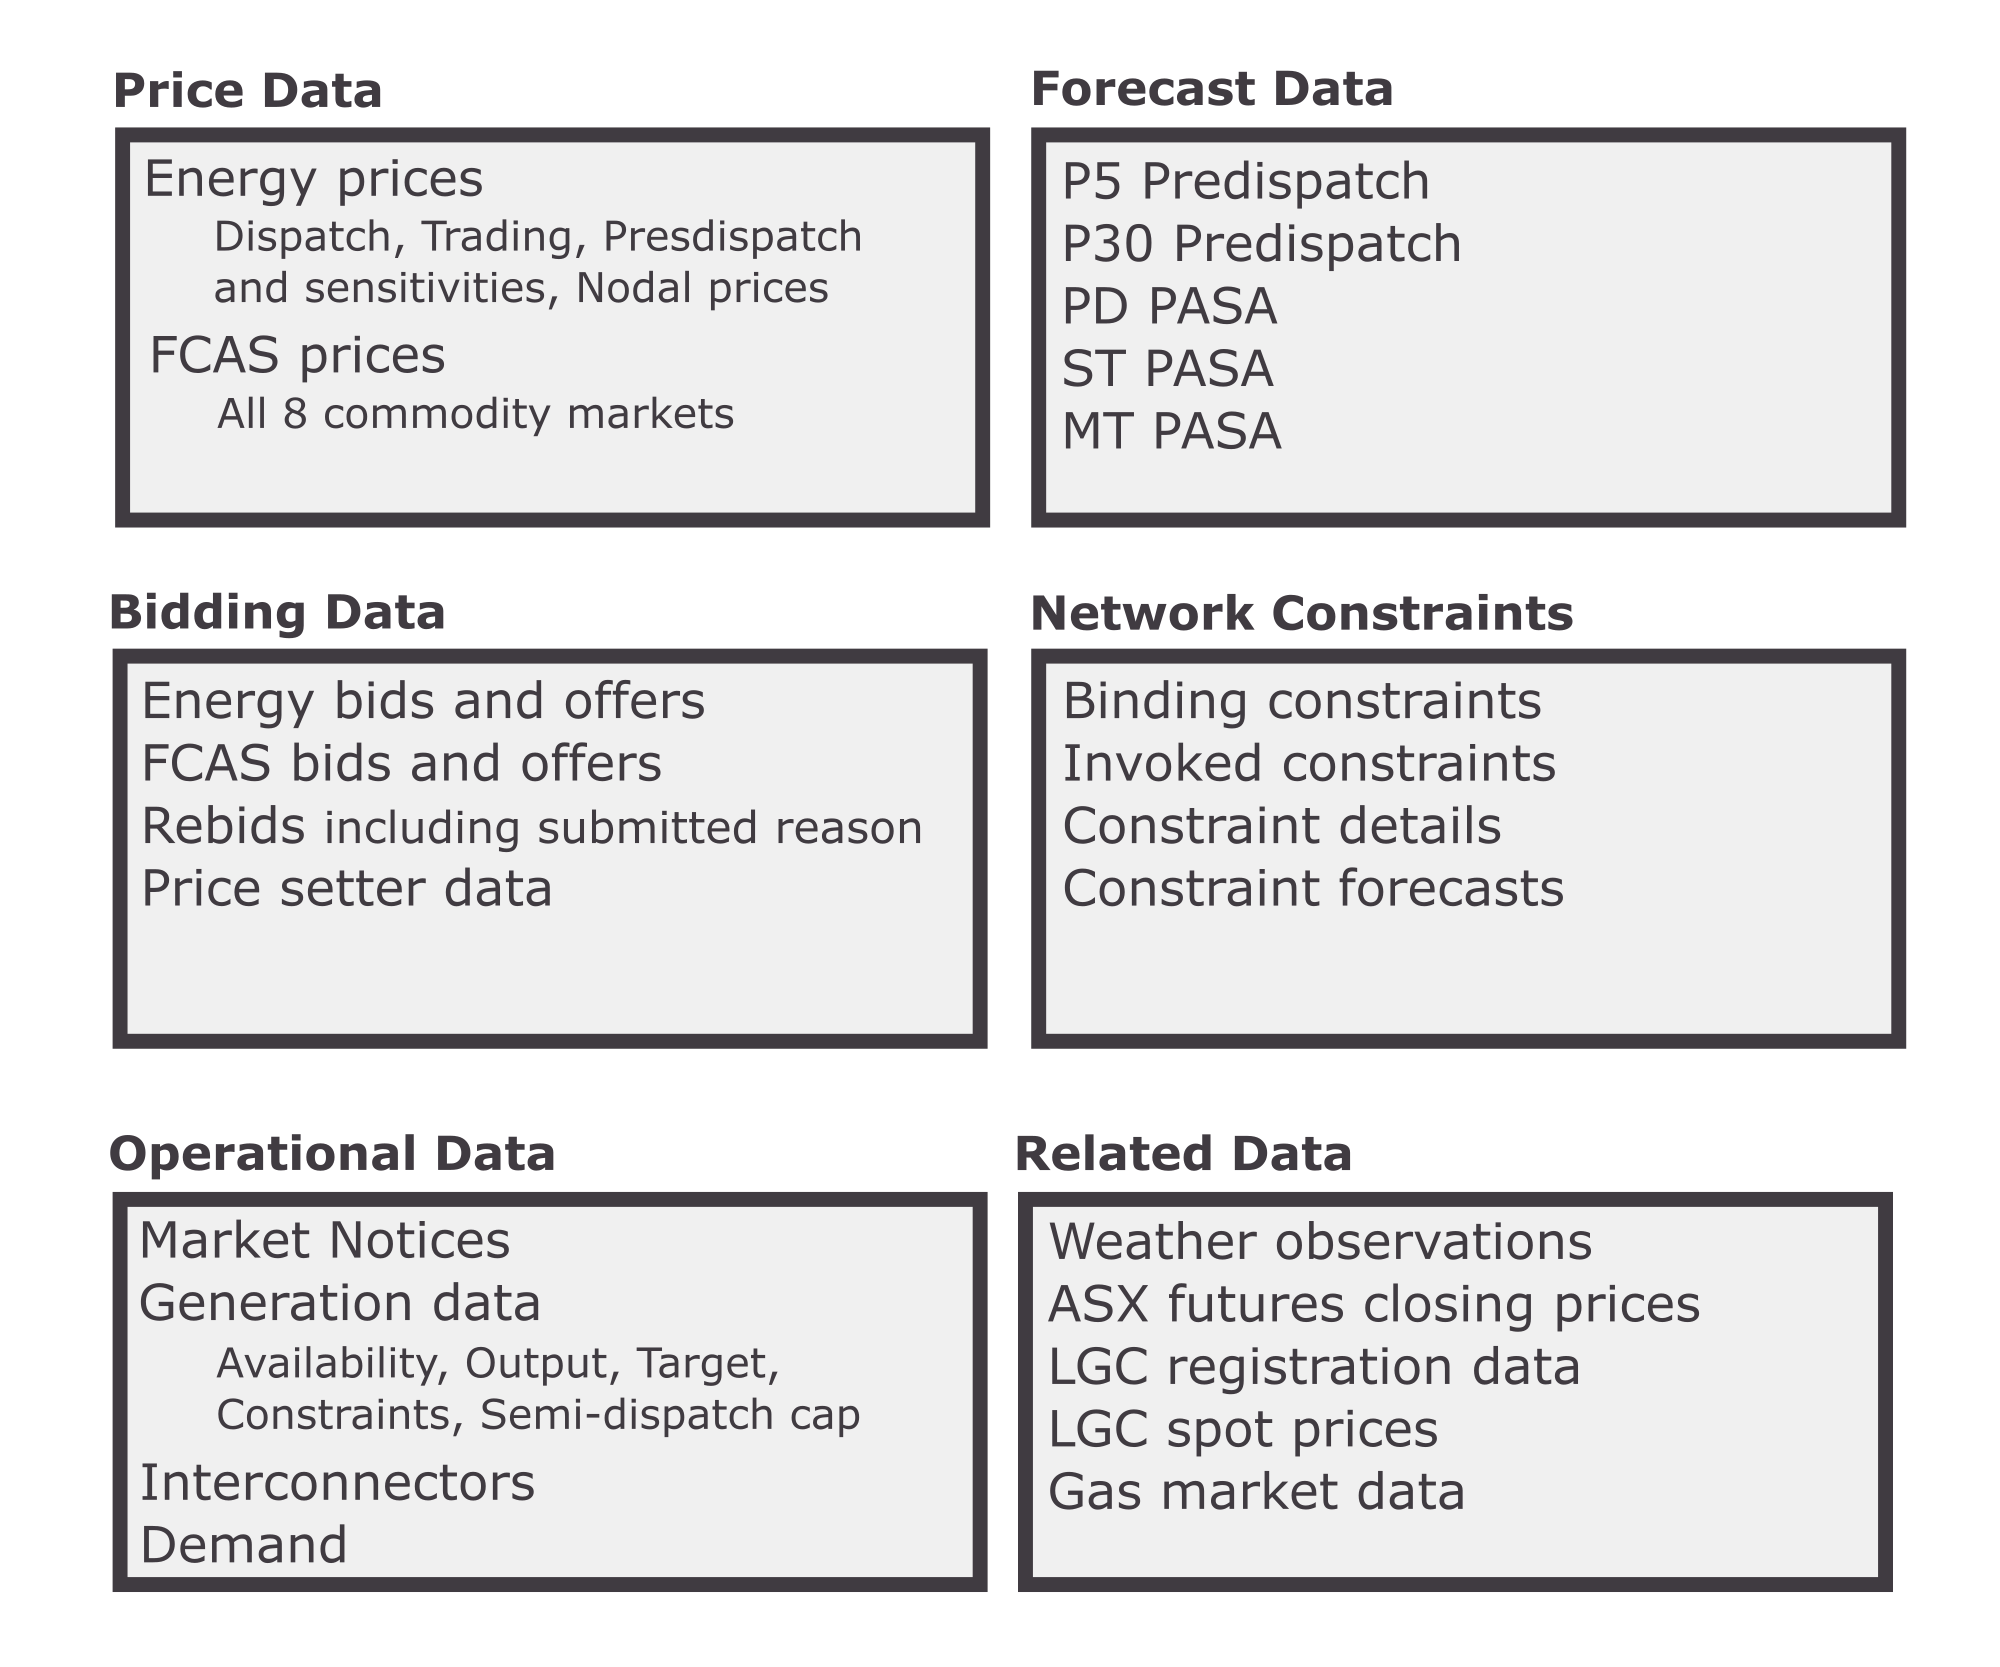
Additionally, ez2view gives you the ability to integrate your own private AEMO data into the software.
Powerful insights.
Effective displays and practical tools
We use the term “widget” to describe a display element or individual tool that you can launch within the software. There are over 50 different widgets you can access, and each one is designed specifically for the constructs of the NEM. Each one is focused on a different area of the market, and new ones are released periodically by our development team. Some examples of key widgets inside ez2view include regional schematics, unit dashboards, price displays and forecast convergence.
Linking key data for practical use
In our 20+ years of experience making NEM-specific software solutions, we've built tools and visuals that combine relevant data so that you can understand the relationships between metrics when analysing more complex market processes such as unit dispatch, constraint equations and bidding.
Drill-down links to explore detail
One key aspect of ez2view's design is built-in clickable hyperlinks that connect widgets - similar to what you would be used to using in a web browser. Having these context-sensitive links allows you to drill-in so that you can progressively gain more detail.
Flexible charting of time-series data
Customise your own time-series charts from a large historical database and publish them into the application so that you can monitor data and trends that are important to you.
Point in time construction for forensic analysis

In ez2view you have control over time. By default all information is displayed in real-time, but with the click of a button you can switch to time-travel mode and set the clock to see what was happening for any historical dispatch interval since back to late 2010.
Essential tools of the trade.
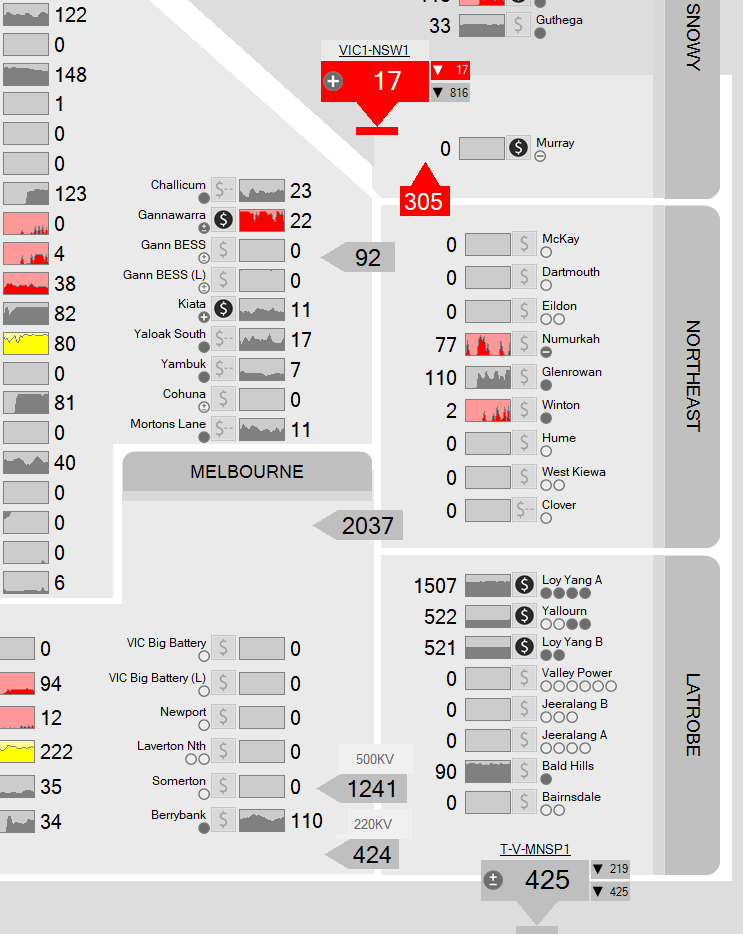
High-level overviews
ez2view contains numerous summary displays that give you visibility over what is happening at a region, zone, station or unit level at a glance in real-time, or alternatively, you can use some of these overviews to inspect a previous dispatch interval in time-travel mode. Some of the high-level overviews within ez2view include:
- Price and price forecast summaries
- Regional generation summaries
- Current constraints overview
- Individual station and unit dashboards
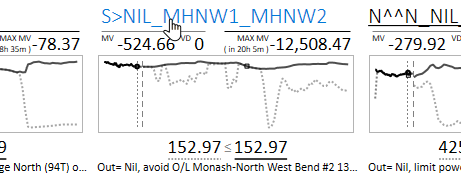
In-depth analysis tools
Our more focused tools and views provide in-depth insights on specific parts of the market so that you can perform your own analysis on areas such as:
- Network constraints
- Bidding including bid stacks and rebidding
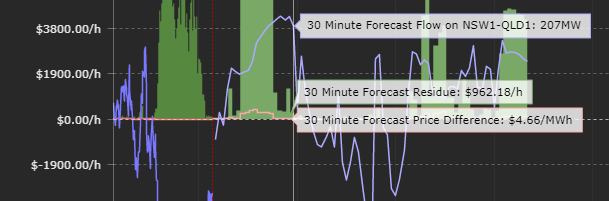
- Forecasts including convergence of forecasts
- Interconnector flows including constraints
Alerts
You can configure your own on-screen, audio, SMS or email alerts so that you can be notified when specific market events and conditions affect your organisation.
And we're not done yet.
Ongoing Agile Development
Our experienced agile development team consistently work with the feedback from our ez2view clients so that we are continually improving the product by building new widgets and making new releases.
You can vist our Timeline of Development site to see the outcomes of our agile process.
Training and Support
Comprehensive training is provided by our team and office-hours support is available to all clients, so that you can get the help that you need.